欢迎您访问我爱IT技术网,今天小编为你分享的编程技术是:【ASP.NET实现类似Excel的数据透视表】,下面是详细的分享!
ASP.NET实现类似Excel的数据透视表
代码:Pivot.zip
数据透视表提供的数据三维视图效果,在Microsoft Excel能创建数据透视表,但是,它并不会总是很方便使用Excel。您可能希望在Web应用程序中创建一个数据透视报表。创建一个简单的数据透视表可能是一件非常复杂的任务。所以,我打算不但为你提供一个非常有用的工具创建简单和高级的数据透视表,而且为你移除一些笼罩他们的神秘面纱。
目标是:我们想要有能力将datatable中的二维的数据转换成三维视图。
在大多数情况下,你会从数据库的查询数据填充数据表,例如
以下为引用的内容: SELECT
SalesPeople.FullName AS [Sales Person]
, Products.FullName AS [Product]
, SUM(Sales.SalesAmount) AS [Sale Amount]
, SUM(Sales.Qty) AS [Quantity]
FROM
Sales
JOIN
SalesPeople WITH (NOLOCK)
ON SalesPeople.SalesPersonID=Sales.SalesPersonID
JOIN
Products WITH (NOLOCK)
ON Products.ProductCode=Sales.ProductCode
GROUP BY
SalesPeople.FullName
, Products.FullName
该查询会产生下面的数据表:
|
Sales Person |
Product |
Quantity |
Sale Amount |
|
John |
Pens |
200 |
350 |
|
John |
Pencils |
400 |
500 |
|
John |
Notebooks |
100 |
300 |
|
John |
Rulers |
50 |
100 |
|
John |
Calculators |
120 |
1200 |
|
John |
Back Packs |
75 |
1500 |
|
Jane |
Pens |
225 |
393.75 |
|
Jane |
Pencils |
335 |
418.75 |
|
Jane |
Notebooks |
200 |
600 |
|
Jane |
Rulers |
75 |
150 |
|
Jane |
Calculators |
80 |
800 |
|
Jane |
Back Packs |
97 |
1940 |
|
Sally |
Pens |
202 |
353.5 |
|
Sally |
Pencils |
303 |
378.75 |
|
Sally |
Notebooks |
198 |
600 |
|
Sally |
Rulers |
98 |
594 |
|
Sally |
Calculators |
80 |
800 |
|
Sally |
Back Packs |
101 |
2020 |
|
Sarah |
Pens |
112 |
196 |
|
Sarah |
Pencils |
245 |
306.25 |
|
Sarah |
Notebooks |
198 |
594 |
|
Sarah |
Rulers |
50 |
100 |
|
Sarah |
Calculators |
66 |
660 |
|
Sarah |
Back Packs |
50 |
2020 |
正如你所看到的,这是一个二维表,它不是一个非常有用的报表。因此,我们得改变,将它变成更可读的数据表。
数据透视表有3个面:
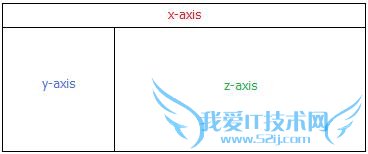
X轴构成了在表格上方的大标题。Y轴构成表的左栏,Z轴构成了X轴和Y轴对应的值。简单的数据透视表将会对每一个x轴值都只有一个z轴列,高级的数据透视表将对于每个X轴的值会对应有多个Z轴的值。
一个非常重要的一点是,Z轴的值只能是数字。这是因为Z轴值为横轴和纵轴的总额。使用一个非数值Z轴字段将抛出一个异常。
因此,如果你注意上面的数据表,你会发现,“Sales Person”和“Product”字段可以分配到的X轴或Y轴,但不能给z轴。在“Quantity”和“Sale Amount”字段可以被分配到z轴。
Pivot 类将数据表转换成html table。然后您可以将它输出到Web窗体上。那么,这只是实现的方法。如果你愿意,你可以根据这个类的逻辑创建一个用户控件。
|
以下为引用的内容: #region Variables |
这部分的代码是非常自我解释。 你能创建一个Pivot 对象,通过传递一个datatable作为参数。在init()方法只分配一个空字符串值给CSS变量。如果CSS的变量是一个空字符串,构造方法将使用默认的样式。每一个CSS变量都有一个相应的属性。
|
以下为引用的内容: private string FindValue(string xAxisField, string xAxisValue, string yAxisField, string yAxisValue, string zAxisField) |
以下为引用的内容:
/// <summary>
/// Creates an advanced 3D Pivot table.
/// </summary>
/// <param name="xAxisField">The main heading at the top of the report.</param>
/// <param name="yAxisField">The heading on the left of the report.</param>
/// <param name="zAxisFields">The sub heading at the top of the report.</param>
/// <returns>HtmlTable Control.</returns>
public HtmlTable PivotTable(string xAxisField, string yAxisField, string[] zAxisFields)
{
HtmlTable table=new HtmlTable();
//style table
TableStyle(table);
try
{
//get distinct xAxisFields
ArrayList xAxis=new ArrayList();
foreach (DataRow row in _DataTable.Rows)
{
if (!xAxis.Contains(row[xAxisField]))
xAxis.Add(row[xAxisField]);
}
//get distinct yAxisFields
ArrayList yAxis=new ArrayList();
foreach (DataRow row in _DataTable.Rows)
{
if (!yAxis.Contains(row[yAxisField]))
yAxis.Add(row[yAxisField]);
}
//create a 2D array for the y-axis/z-axis fields
int zAxis=zAxisFields.Length;
if (zAxis < 1)
zAxis=1;
string[,] matrix=new string[(xAxis.Count * zAxis), yAxis.Count];
string[] zAxisValues=new string[zAxis];
for (int y=0; y < yAxis.Count; y++) //loop thru y-axis fields
{
//rows
for (int x=0; x < xAxis.Count; x++) //loop thru x-axis fields
{
//main columns
//get the z-axis values
zAxisValues=FindValues(xAxisField, Convert.ToString(xAxis[x])
, yAxisField, Convert.ToString(yAxis[y]), zAxisFields);
for (int z=0; z < zAxis; z++) //loop thru z-axis fields
{
//sub columns
matrix[(((x + 1) * zAxis - zAxis) + z), y]=zAxisValues[z];
}
}
}
//calculate totals for the y-axis
decimal[] yTotals=new decimal[(xAxis.Count * zAxis)];
for (int col=0; col < (xAxis.Count * zAxis); col++)
{
yTotals[col]=0;
for (int row=0; row < yAxis.Count; row++)
{
yTotals[col] +=Convert.ToDecimal(matrix[col, row]);
}
}
//calculate totals for the x-axis
decimal[,] xTotals=new decimal[zAxis, (yAxis.Count + 1)];
for (int y=0; y < yAxis.Count; y++) //loop thru the y-axis
{
int zCount=0;
for (int z=0; z < (zAxis * xAxis.Count); z++) //loop thru the z-axis
{
xTotals[zCount, y] +=Convert.ToDecimal(matrix[z, y]);
if (zCount==(zAxis - 1))
zCount=0;
else
zCount++;
}
}
for (int xx=0; xx < zAxis; xx++) //Grand Total
{
for (int xy=0; xy < yAxis.Count; xy++)
{
xTotals[xx, yAxis.Count] +=xTotals[xx, xy];
}
}
//Build HTML Table
//Append main row (x-axis)
HtmlTableRow mainRow=new HtmlTableRow();
mainRow.Cells.Add(new HtmlTableCell());
for (int x=0; x <=xAxis.Count; x++) //loop thru x-axis + 1
{
HtmlTableCell cell=new HtmlTableCell();
cell.ColSpan=zAxis;
if (x < xAxis.Count)
cell.InnerText=Convert.ToString(xAxis[x]);
else
cell.InnerText="Grand Totals";
//style cell
MainHeaderTopCellStyle(cell);
mainRow.Cells.Add(cell);
}
table.Rows.Add(mainRow);
//Append sub row (z-axis)
HtmlTableRow subRow=new HtmlTableRow();
subRow.Cells.Add(new HtmlTableCell());
subRow.Cells[0].InnerText=yAxisField;
//style cell
SubHeaderCellStyle(subRow.Cells[0]);
for (int x=0; x <=xAxis.Count; x++) //loop thru x-axis + 1
{
for (int z=0; z < zAxis; z++)
{
HtmlTableCell cell=new HtmlTableCell();
cell.InnerText=zAxisFields[z];
//style cell
SubHeaderCellStyle(cell);
subRow.Cells.Add(cell);
}
}
table.Rows.Add(subRow);
//Append table items from matrix
for (int y=0; y < yAxis.Count; y++) //loop thru y-axis
{
HtmlTableRow itemRow=new HtmlTableRow();
for (int z=0 ; z <=(zAxis * xAxis.Count); z++) //loop thru z-axis + 1
{
HtmlTableCell cell=new HtmlTableCell();
if (z==0)
{
cell.InnerText=Convert.ToString(yAxis[y]);
//style cell
MainHeaderLeftCellStyle(cell);
}
else
{
cell.InnerText=Convert.ToString(matrix[(z-1), y]);
//style cell
ItemCellStyle(cell);
}
itemRow.Cells.Add(cell);
}
//append x-axis grand totals
for (int z=0; z < zAxis; z++)
{
HtmlTableCell cell=new HtmlTableCell();
cell.InnerText=Convert.ToString(xTotals[z, y]);
//style cell
TotalCellStyle(cell);
itemRow.Cells.Add(cell);
}
table.Rows.Add(itemRow);
}
//append y-axis totals
HtmlTableRow totalRow=new HtmlTableRow();
for (int x=0; x <=(zAxis * xAxis.Count); x++)
{
HtmlTableCell cell=new HtmlTableCell();
if (x==0)
cell.InnerText="Totals";
else
cell.InnerText=Convert.ToString(yTotals[x-1]);
//style cell
TotalCellStyle(cell);
totalRow.Cells.Add(cell);
}
//append x-axis/y-axis totals
for (int z=0; z < zAxis; z++)
{
HtmlTableCell cell=new HtmlTableCell();
cell.InnerText=Convert.ToString(xTotals[z, xTotals.GetUpperBound(1)]);
//style cell
TotalCellStyle(cell);
totalRow.Cells.Add(cell);
}
table.Rows.Add(totalRow);
}
catch
{
throw;
}
return table;
}
Pivot.zip文件中包括两个解决方案。Pivot 是一个类库解决方案是。您可以编译此解决方案和在Web应用程序中引用Pivot.dll。另一个解决方案是PivotTest,它是是一个ASP.NET应用程序。这说明如何实现Pivot类。
|
以下为引用的内容: public DataTable DataTableForTesting |
我已创建数据表的属性,它建立在上面的例子中的数据表。这只是用于演示目的。
|
以下为引用的内容: protected void Page_Load(object sender, EventArgs e) |
上述代码包括两个实例化的pivot对象。第一个高级的pivot和第二是一个简单的pivot。你可以看到我已经为div添加了HtmlTable控件。我创建具有runat="server"属性的div,这样我可以在后台代码里面访问它。div只是帮助HtmlTable的定位。
使用默认样式的高级的数据透视表:
|
运行代码: <table style="BORDER-RIGHT: black 1px solid; BORDER-TOP: black 1px solid; BORDER-LEFT: black 1px solid; WIDTH: 484px; BORDER-BOTTOM: black 1px solid; HEIGHT: 197px"> |
使用自定义的CSS样式简单的数据透视表:
|
Sales Person |
Pens |
Pencils |
Notebooks |
Rulers |
Calculators |
Back Packs |
Grand Totals |
|
John |
350 |
500 |
300 |
100 |
1200 |
1500 |
3950 |
|
Jane |
393.75 |
418.75 |
600 |
150 |
800 |
1940 |
4302.50 |
|
Sally |
353.5 |
378.75 |
600 |
594 |
800 |
2020 |
4746.25 |
|
Sarah |
196 |
306.25 |
594 |
100 |
660 |
2020 |
3876.25 |
|
Totals |
1293.25 |
1603.75 |
2094 |
944 |
3460 |
7480 |
16875.00 |
代码:Pivot.zip
以上所分享的是关于ASP.NET实现类似Excel的数据透视表,下面是编辑为你推荐的有价值的用户互动:
相关问题:Excel中怎么用公式实现类似数据透视表的功能?
答:使用辅助列可以解决,把问题作为内容(邮件主题一定要包含“excel”,本人以此为依据辨别非垃圾邮件,以免误删),excel样表文件(把现状和目标效果表示出来)作为附件发来看下 yqch134@163.com >>详细
相关问题:EXCEL2010 数据透视表如何按指定项目实现分类汇总?
答:你的区域是单独的表项吗? 要是才能按照区域分类的 不想对其汇总的项目对该字段设置分类汇总为“无”就是了 隐藏的话很简单啊 看到 + -号了吗 >>详细
相关问题:请问有哪位可以教我使用EXCEL中的数据透视表功能来...
答:选中要统计的区域,数据-->数据透视表或数据透视图 出现对话框后,步骤1,下一步-->步骤2,下一步-->步骤3,打开“布局”,把右边的“品号”拖到左边表格的“行”内,把“数量”拖到“数据”内(默认为求和,如需改变,双击,即可修改)。改完后,点“确定”... >>详细
- 评论列表(网友评论仅供网友表达个人看法,并不表明本站同意其观点或证实其描述)
-