欢迎您访问我爱IT技术网,今天小编为你分享的javascript教程:【纯JAVASCRIPT图表动画插件Highcharts Examples】,下面是详细的讲解!
纯JAVASCRIPT图表动画插件Highcharts Examples
What is Highcharts? 下载地址 http://www.jb51.net/jiaoben/24363.html
Highcharts is a charting library written in pure JavaScript, offering an easy way of adding interactive charts to your web site or web application. Highcharts currently supports line, spline, area, areaspline, column, bar, pie and scatter chart types.
Features
It works in all modern browsers including the iPhone/iPad and Internet Explorer from version 6. Standard browsers use SVG for the graphics rendering. In Internet Explorer graphics are drawn using VML.
.
Highcharts is solely based on native browser technologies and doesn't require client side plugins like Flash or Java. Furthermore you don't need to install anything on your server. No PHP or ASP.NET. Highcharts needs only two JS files to run: The highcharts.js core and either the jQuery or the MooTools framework. One of these frameworks is most likely already in use in your web page.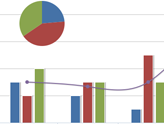
Highcharts supports line, spline, area, areaspline, column, bar, pie and scatter chart types. Any of these can be combined in one chart.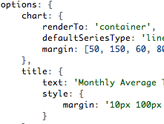
Setting the Highcharts configuration options requires no special programming skills. The options are given in a JavaScript object notation structure, which is basically a set of keys and values connected by colons, separated by commas and grouped by curly brackets.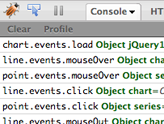
Through a full API you can add, remove and modify series, axes or points at any time after chart creation. Numerous events supply hooks for programming agains the chart. In combination with jQuery's or MooTools' Ajax API, this opens for solutions like live charts constantly updating with values from the server, user supplied data and more.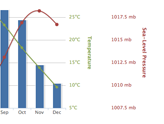
Sometimes you want to compare variables that are not the same scale - for example temperature versus rainfall and air pressure. Highcharts lets you assign an y axis for each series - or an x axis if you want to compare data sets of different categories. Each axis can be placed to the right or left, top or bottom of the chart. All options can be set individually, including reversing, styling and position.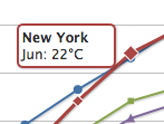
On hovering the chart Highcharts can display a tooltip text with information on each point and series. The tooltip follows as the user moves the mouse over the graph, and great efforts have been taken to make it stick to the nearest point as well as making it easy to read a point that is below another point.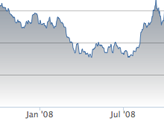
75% of all charts with an X and Y axis have a date-time X axis. Therefore Highchart is very intelligent about time values. With milliseconds axis units, Highcharts determines where to place the ticks so that they always mark the start of the month or the week, midnight and midday, the full hour etc.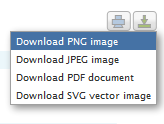
With the exporting module enabled, your users can export the chart to PNG, JPG, PDF or SVG format at the click of a button, or print the chart directly from the web page.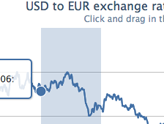
By zooming in on a chart you can examine an especially interesting part of the data more closely. Zooming can be in the X or Y dimension, or both.
Highcharts takes the data in a JavaScript array, which can be defined in the local configuration object, in a separate file or even on a different site. Furthermore, the data can be handled over to Highcharts in any form, and a callback function used to parse the data into an array.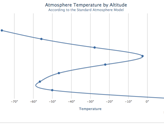
Sometimes you need to flip over your chart and make the X axis appear vertical, like for example in a bar chart. Reversing the axis, with the highest values appearing closest to origo, is also supported.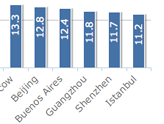
Do you want to use Highcharts for a personal website, a school site or a non-profit organisation? Then you don't need the author's permission, just go on and use Highcharts. For commercial websites and projects, see
关于纯JAVASCRIPT图表动画插件Highcharts Examples的用户互动如下:
相关问题:请教关于Highcharts的问题,js的图表插件
答: $(function () { $('#container').highcharts({ chart: { zoomType: 'xy' }, title: { text: 'Combination chart' }, xAxis: { categories: ['Apples', 'Oranges', 'Pears', 'Bananas', 'Plums'] }, yAxis: [{ // Primary yAxis labels: { form... >>详细
相关问题:javascript插件的 highcharts 图表legend遮住了线...
答:API里面有的啊,设置highcharts的时候有个legend的设置的,http://www.hcharts.cn/api/index.php#legend.x >>详细
相关问题:我要做个这样的图表用jquery的什么插件能实现
答:13 个JavaScript图表和图形绘制插件。少数是独立的框架,大多数支持条图、线图、饼图等基本图形,很多甚至支持更加复杂的图形, 比如:维恩图、热图、进化树、二维散点图、二维散点气泡图、三维散点图等。相信你应当能在这个列表中找到所需的。 ... >>详细
- 【firefox】firefox浏览器不支持innerText的解决
- 【Extjs】Extjs学习过程中新手容易碰到的低级错误
- 【clearInterval】js clearInterval()方法的定义
- 【ComboBox】ComboBox 和 DateField 在IE下消失的
- 【dom】javascript dom追加内容实现示例-追加内容
- 【has】基于jquery的has()方法以及与find()方法以
- 【extjs】Extjs入门之动态加载树代码-动态加载树
- 【checkbox】让checkbox不选中即将选中的checkbox
- 【Array】js中更短的 Array 类型转换-类型转换
- 【append】append和appendTo的区别以及appendChil
- 评论列表(网友评论仅供网友表达个人看法,并不表明本站同意其观点或证实其描述)
-